Census 2021
Explore the changes in Oxfordshire’s population from the Census carried out on 21 March 2021.
The census takes place every ten years. It is a detailed snapshot of all the people and households in England and Wales. Information from the census helps us plan and fund local services, such as education and roads.
One in six people in England and Wales were born outside of the UK and that figure is slightly higher in Oxfordshire at 18.7 per cent or just over one in five.
Data from Oxfordshire is currently being released – and it’s telling us that Oxfordshire is changing.
The population has grown
There has been an increase in the population, but the data is also telling us that there have been shifts in where people are living.
In 2011 the population of Oxfordshire was 653,798 in 2021 this had increased to 725,314, an increase of 71,516 (+11 per cent).
Where people live
Oxfordshire has changed over the last 10 years. As the population rises, we can see distinct changes in the choices our residents make about where they live.
Our map below shows which areas of our county have grown or shrunk in population in the last 10 years. Blue means there are fewer people living in an area, green areas are those that have grown, and white has remained the same.
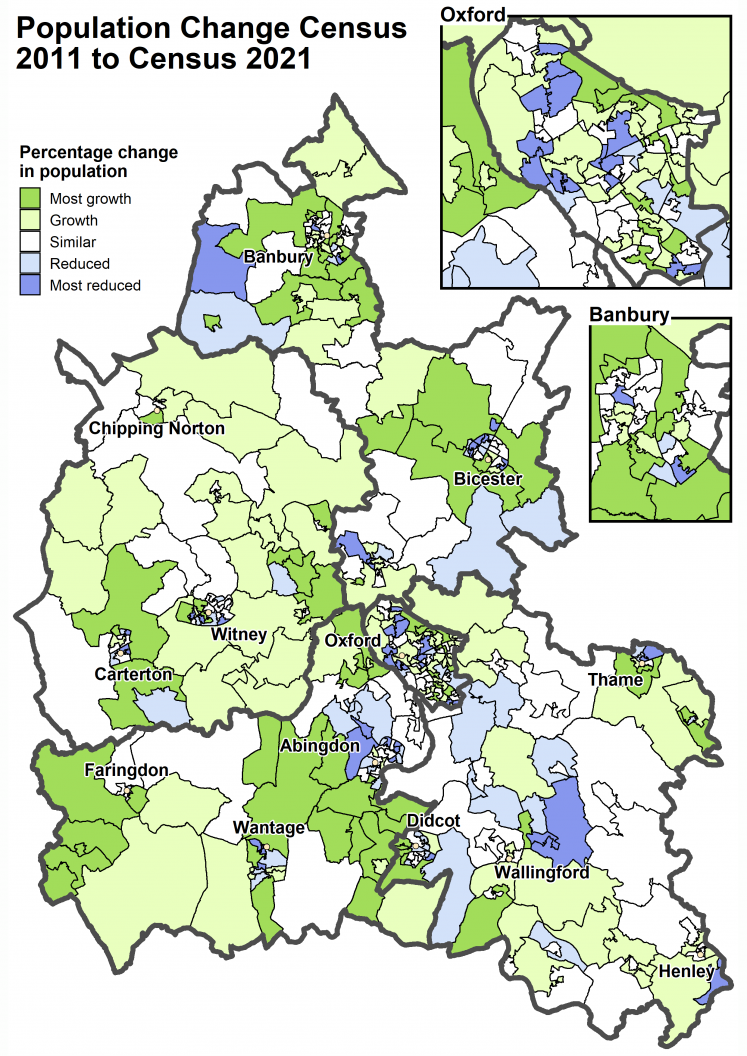
Biggest changes
Growth
- Islip, Arncott and Chesterton has grown by 243 per cent
- Hagbourne, Moreton and Cholsey has grown by 231 per cent
- South Wantage, Harwell and Blewbury has grown by 191 per cent
Reduction
- Carterton South has shrunk by 40 per cent
- Headington has shrunk by 19 per cent
- Osney, Jericho and Port Meadow has shrunk by 18 per cent
More data
We will be publishing analysis and data for Oxfordshire from the Census 2021 survey on Oxfordshire Insight.
Find out more about the national census.